This is a website for explaining a novel methodology for
sensitivity analysis of agent-based simulation, MASSIVE
(Massively parallel Agent-based Simulations and Subsequent
Interactive Visualization-based Exploration). Employing a supercomputer,
MASSIVE performs a huge number of agent-based simulations
with a broad range of parameter settings and enables us to intuitively explore the massive
results via an interactive visualization tool, the MASSIVE viewer.
As an explanatory example, this website presents
massive results from agent-based
simulations of cancer evolution on a one-dimensional lattice
with free-ends. In each trials of the simulation, a cell divides with
a probability of 104
until the population size reaches at P
or time reach at 106.
In each cell division, m mutations
are generated on average and each cell can accumulate 3 mutations at maximum.
Resources are provided from both the ends
of the one-dimensional lattice and subject
to exponential decays with a half-distance parameter d.
Each mutation increases the cell division rate by f fold if no
resource bias exists (i.e., with infinite d).
In the presence of a resource bias, the cell division rate is
calculated by further multiplying the resource distribution.
For convenience, we converted the parameters as follows:
m′ = −log10(m),
f′ = log10(f),
p′ = log10(P)
and
d′ = log10(d).
We then tested every combination of
m′ ∈ {1, 2, 3},
f′ ∈ {0.1,0.2,0.3,··· ,1.0},
p′ ∈ {3,4,5} and
d′ ∈ {1,2,3,4,5}, respectively.
Namely, a larger m′ means a smaller mutation rate,
a larger
f′ means a stronger mutation effect,
a larger p′ means a larger maximum population size,
and a larger d′ means a weaker resource bias.
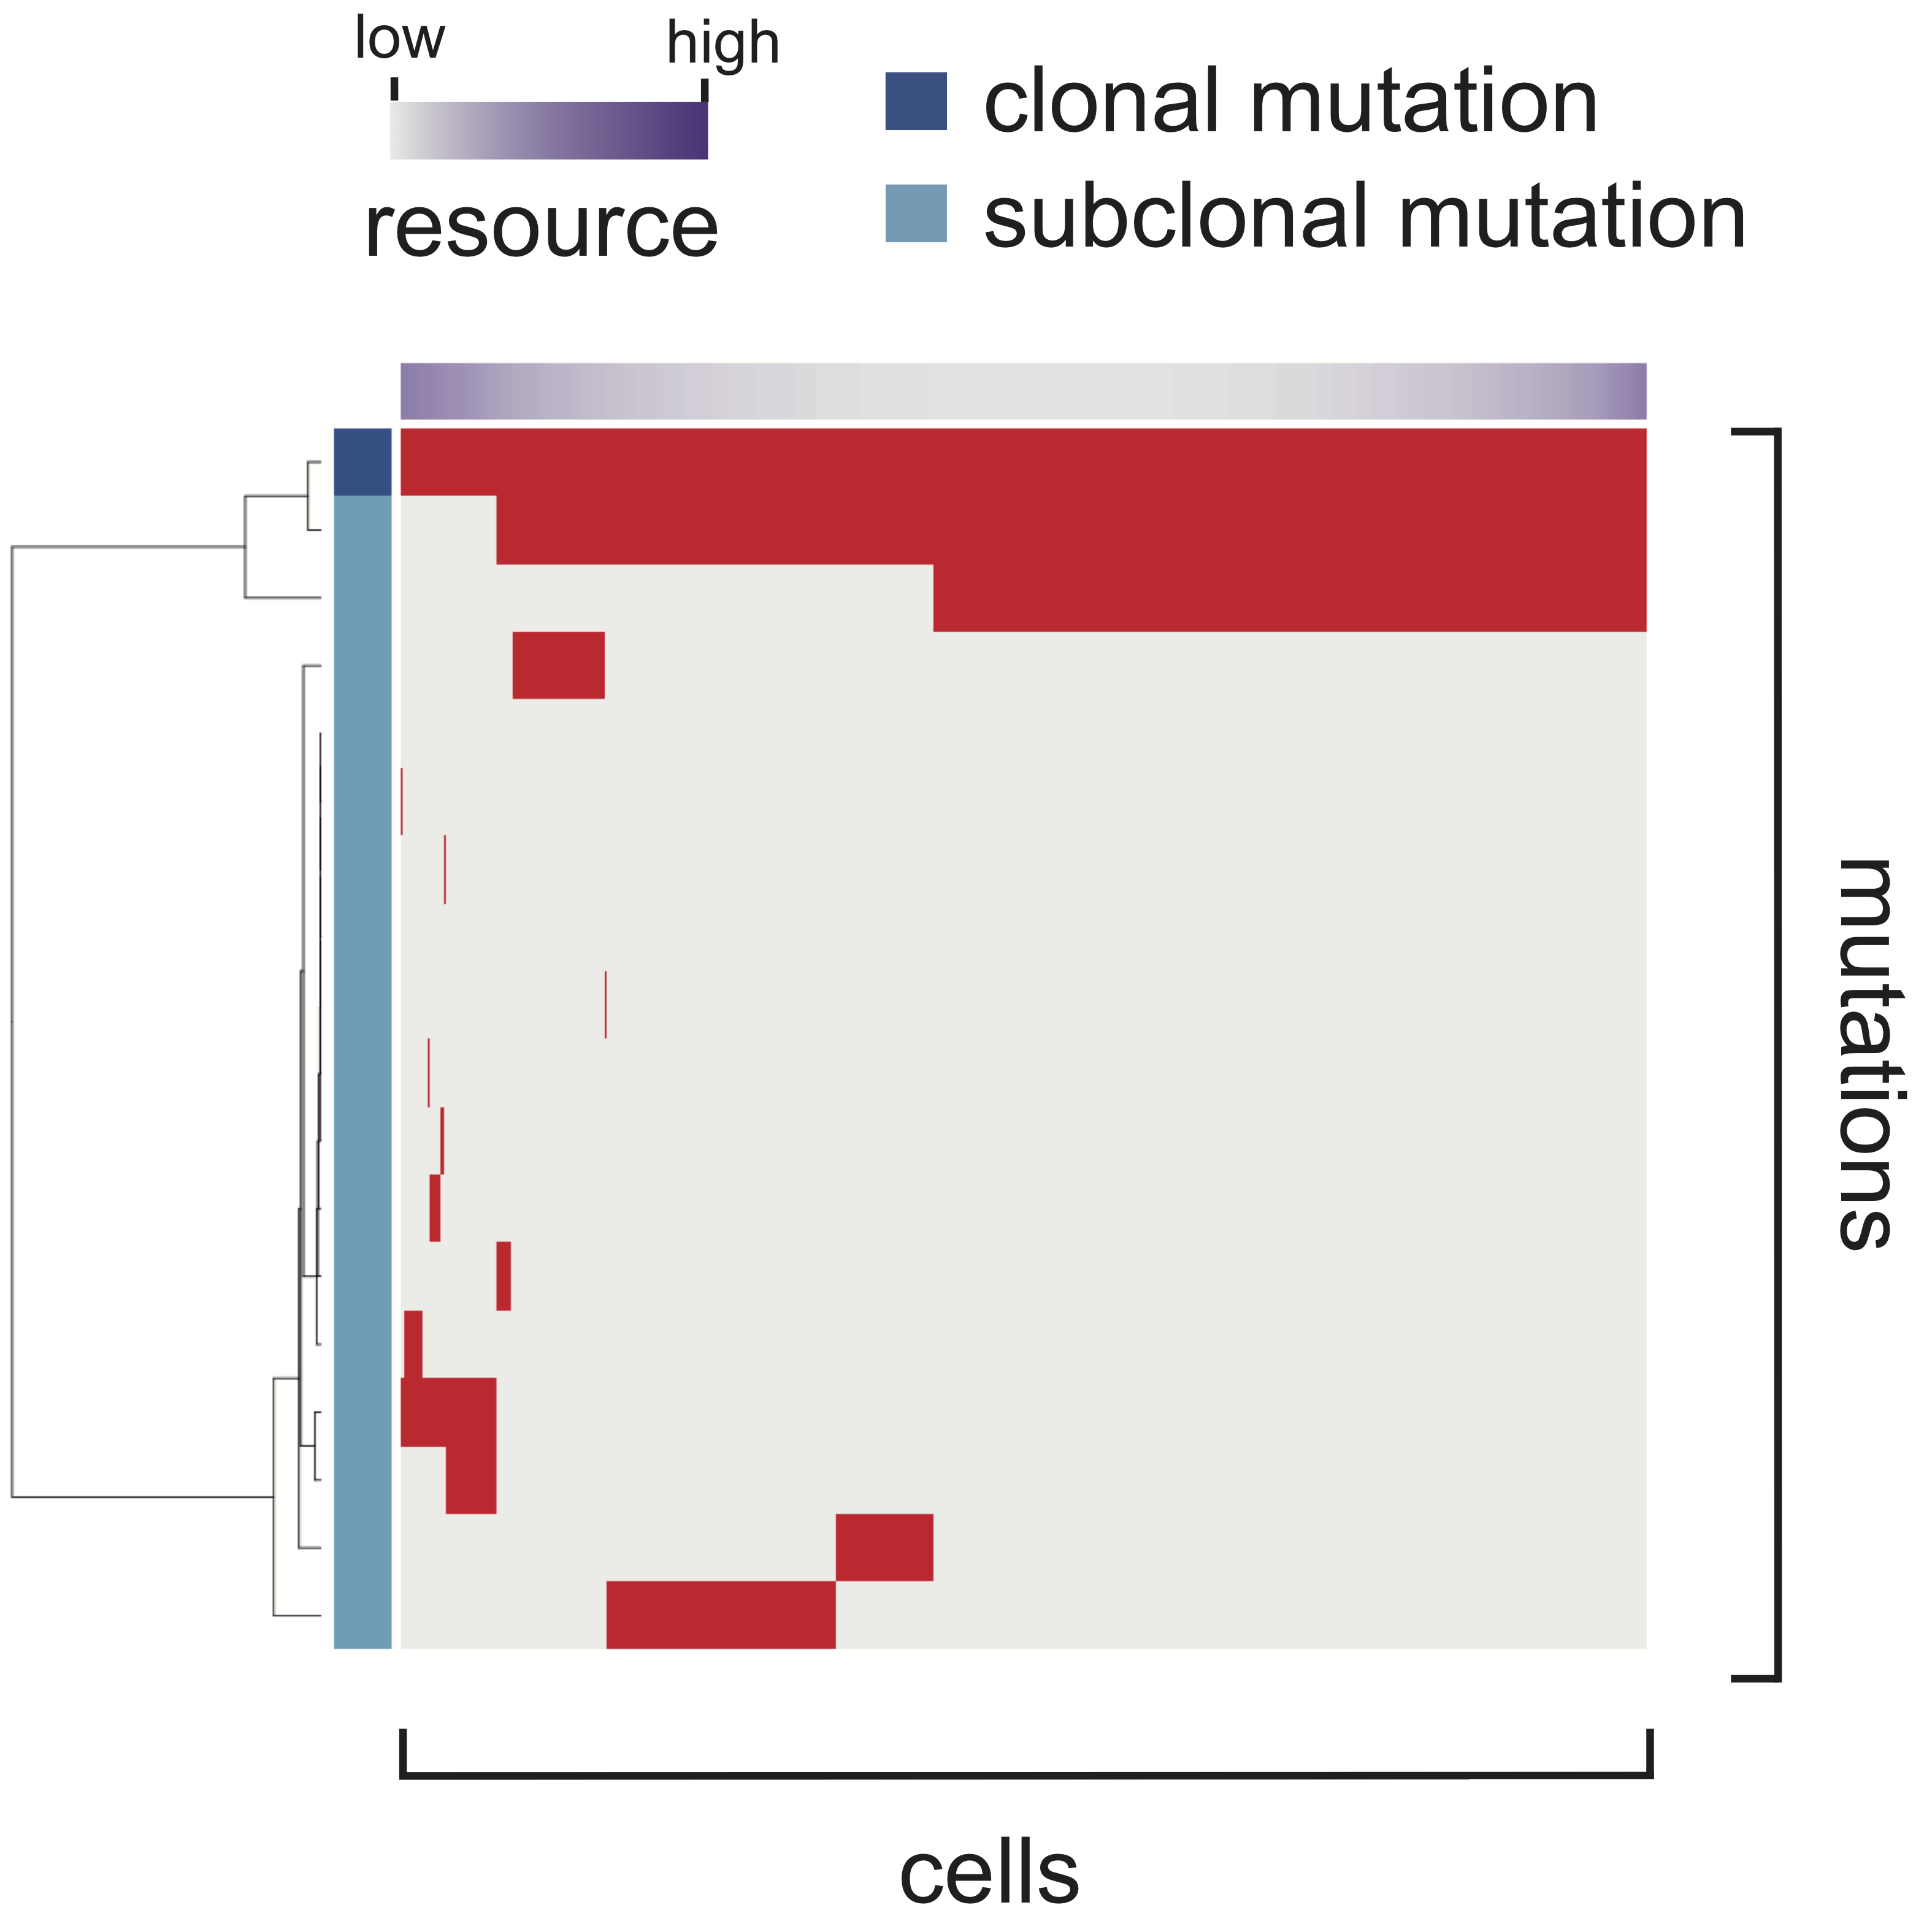
For each parameter setting, we performed 50 Monte Carlo trials,
from which we obtained averaged values of 11 summary statistics (listed in Table 1)
for quantifying simulation results. Mutation profile heat maps
(an example is provided in Figure 1) were also produced from 5 of
the 50 Monte Carlo trials. All the results can be intuitively
explored in the focused and
comparative view modes of the MASSIVE viewer
(see our paper for more details).