Supplementary Data
A regression analysis of gene expression in ES cells reveals two gene classes that are significantly different in epigenetic patterns
Sung-Joon Park and Kenta Nakai
BMC Bioinformatics, 12 (Suppl 1):S50,
[Abstract]
 Supplementary Figures
- Figure S1, S3-S4: [PDF]
- Figure S2: Density profiles for 12 TFs in five peak datasets. [PDF]
- Table S1-S4: [PDF]
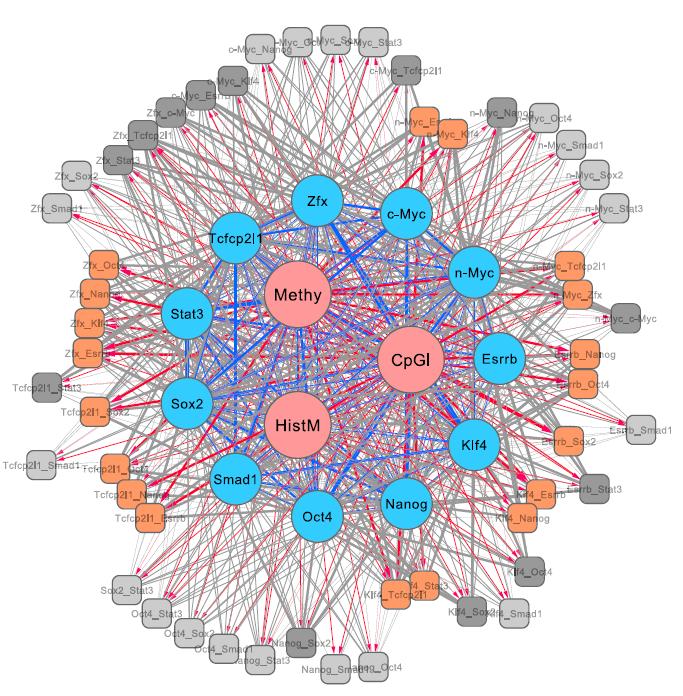
- Cytoscape file for Figure S4: Regulatory network of transcription factor interactions with epigenetic effects in mouse ES cell. [CYS]
Supplementary Data
Latest update: 2010.10.20